For students and beginners, financial
statements often seem confusing, not because the
concepts are difficult, but because the format looks unfamiliar. In India, companies do not
prepare financial
statements randomly. They follow a legally prescribed structure under Schedule III of the
Companies Act,
2013.
Understanding the format of financial statements of a company as per Schedule III is essential if you
are studying commerce, preparing for CA exams, entering audit or accounting roles, or simply trying to
read a company’s financials.
This guide explains the structure in a clear, explanatory way, so you understand why the format exists,
not just what it looks like.
Checkout - Financial
Statements Excel Template
What Are Financial Statements?
Financial statements are structured reports that present the financial position and financial
performance of a company.
Every business records thousands of transactions during a year. Financial statements summarize these
transactions into a standard format so that shareholders, management, auditors, banks, and regulators
can easily understand the company’s financial condition.
In India, the financial statement of a company is governed by Schedule III, which ensures
uniformity and
comparability across companies.
Overview of Financial Statements
As per Schedule III, a complete set of financial statements includes:
- Balance Sheet
- Statement of Profit and Loss
- Cash Flow Statement(mandatory for all companies except OPCs, small companies, and
dormant companies)
Each statement serves a distinct purpose and follows a specific structure prescribed under Schedule
III. Now let’s discuss these three sets of financial statements.
Also read- Top CA Firms in India
and their Stipend
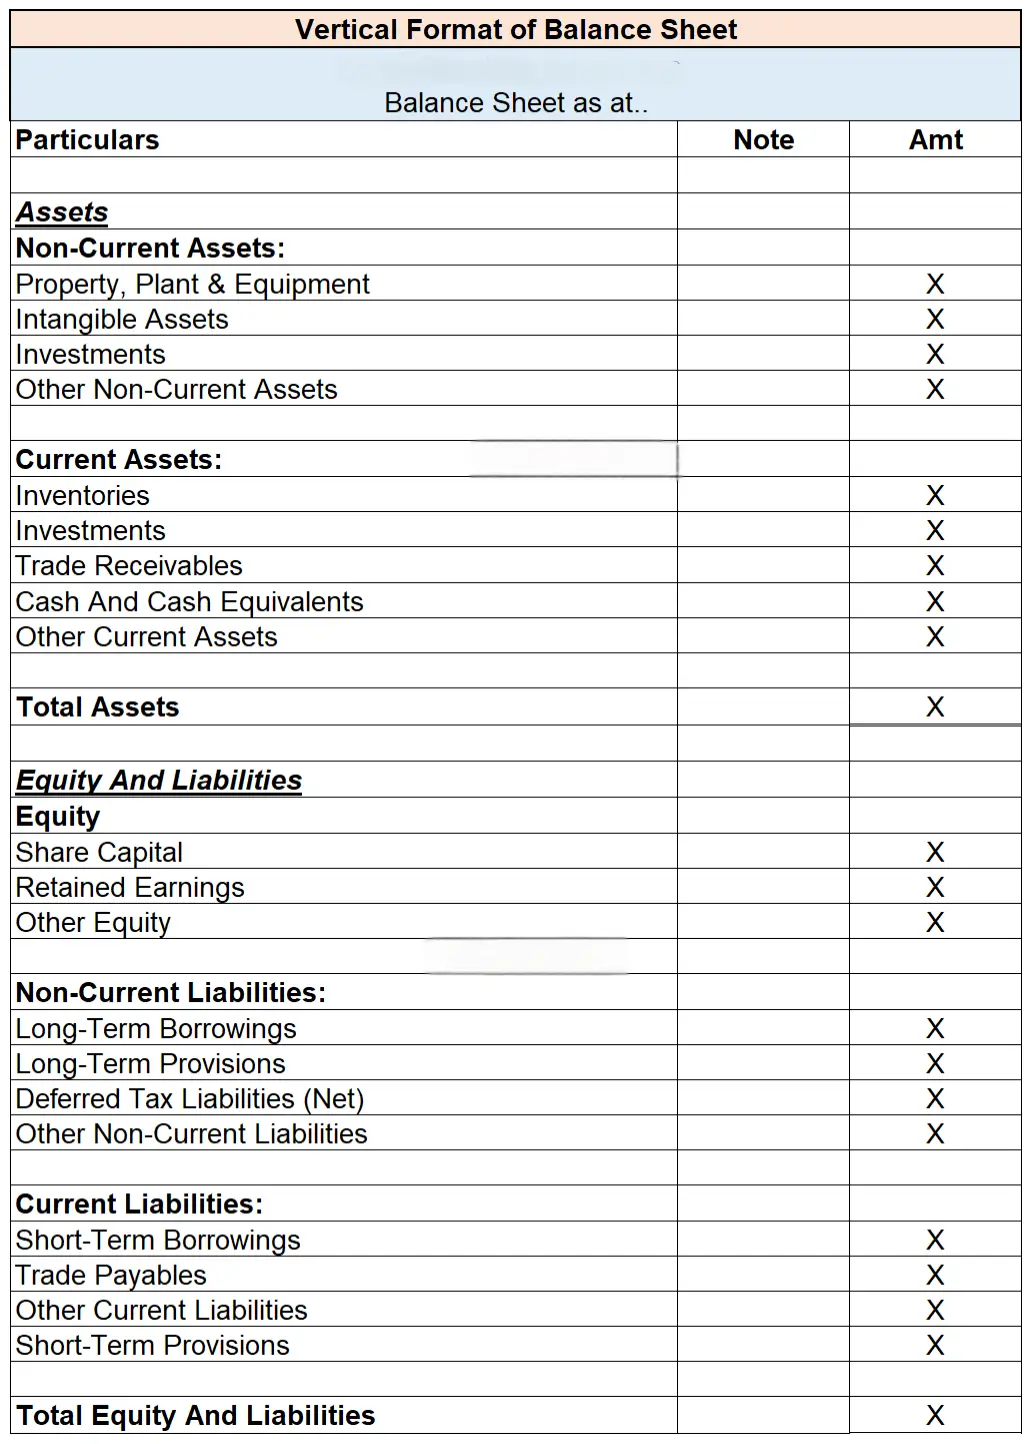
1. Balance Sheet
The Balance Sheet shows the financial position of a company at the end of a reporting period.
It presents:
- What the company owns (assets)
- What the company owes (liabilities)
- What belongs to shareholders (equity)
For this reason, it is also known as the Statement of Financial Position under
Schedule III.
A. Equity and Liabilities – Liability Side of Balance Sheet
Under Schedule III of the Companies Act, 2013, the Balance Sheet follows a vertical
format.
The Equity and Liabilities section explains how the business is financed, that is, where the
funds used by the company come from.
Liabilities are classified into three main categories to improve clarity and comparability.
i. Shareholders’ Funds
Shareholders’ Funds reflect the owners’ stake in the company. It includes money
invested by
shareholders and profits retained in the business over time.
Key components include:
- Share Capital – money raised by issuing shares
- Reserves and Surplus – accumulated profits and retained earnings
A higher shareholders’ fund generally indicates stronger financial stability.
ii. Non-Current Liabilities
Non-current liabilities are obligations payable after 12 months from the Balance Sheet
date.
They
reflect the company’s long-term funding structure.
Common items include:
- Long-term borrowings such as term loans and debentures
- Deferred tax liabilities
- Long-term provisions like gratuity
These liabilities are usually linked to long-term assets and expansion plans.
iii. Current Liabilities
Current liabilities are obligations payable within 12 months. They represent the
company’s
short-term financial commitments.
Typical items include:
- Short-term borrowings
- Trade payables to suppliers
- Other current liabilities, like outstanding expenses and statutory dues
- Short-term provisions
They play a key role in assessing liquidity and working capital.
B. Assets – Asset Side of the Balance Sheet
Under Schedule III of the Companies Act, 2013, assets are presented in a structured manner
to
show where the company has invested its funds.
Assets are resources the company controls that are likely to generate economic value in the
future. Schedule III classifies assets mainly based on time period and nature, making
them easy
to understand and compare.
i. Non-Current Assets
Non-current assets are assets that are not expected to be converted into cash within 12
months from the Balance Sheet date. These assets support the long-term
operations of
the business.
Major components include:
- Property, Plant and Equipment (PPE) such as land, buildings, and machinery
- Intangible assets like software, patents, and goodwill
- Capital work-in-progress
- Long-term investments
- Deferred tax assets (net)
- Other non-current assets
These assets help generate revenue over multiple years.
iii. Current Assets
Current assets are assets that are expected to be realized, sold, or consumed within 12
months.
They are essential for the day-to-day functioning of the business.
Common current assets include:
- Inventories
- Trade receivables
- Cash and cash equivalents
- Short-term loans and advances
- Other current assets
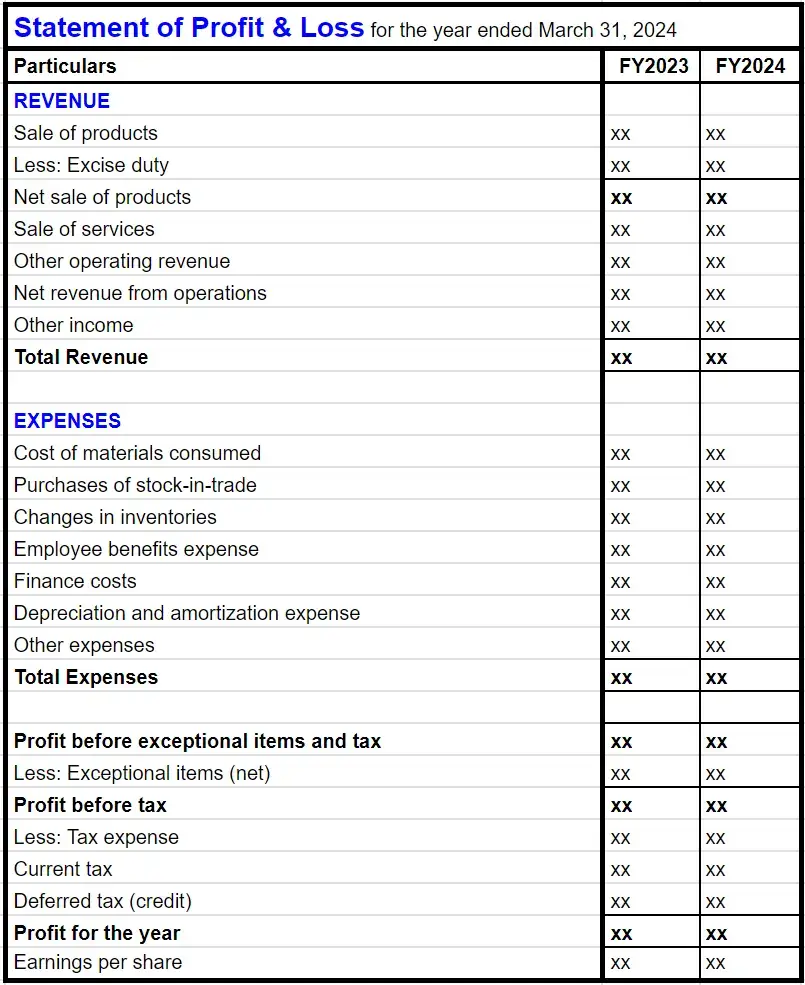
2. Statement of Profit and Loss
The Statement of Profit and Loss shows the financial performance of a company over a
specific period,
usually one financial year.
While the Balance Sheet tells us where the company stands, the Profit & Loss statement explains:
- How much the company earned
- How much did it spent
- whether it made a profit or a loss
A. Structure of Statement of Profit and Loss
Schedule III prescribes a logical and uniform structure so that income and expenses are
clearly
classified.
The statement is broadly divided into Income and Expenses, leading to profit or
loss.
i. Income Section
The income section shows what the company earns during the year.
It mainly includes:
- Revenue from Operations (income from core business activities such as sales or
services)
- Other Income (interest income, dividend income, miscellaneous receipts)
Together, these form the Total Income of the company.
ii. Expense Section
The expense section shows what the company spends to earn that income.
As per Schedule III, expenses are presented under clear heads such as:
- Cost of materials consumed
- Changes in the inventory of finished goods and WIP (work-in-progress)
- Employee benefits expense
- Finance costs
- Depreciation and amortisation
- Other expenses
This classification helps users understand the cost structure of the business.
B. Profit Calculation
After deducting total expenses from total income, the following are determined:
- Profit Before Tax (PBT)
- Tax Expense
- Profit After Tax (PAT)
Profit after tax represents the final earnings available to shareholders.
3. Cash Flow Statement
The Cash Flow Statement shows the actual inflow and outflow of cash and cash equivalents
during a
financial year.
While the Statement of Profit and Loss shows profit on an accrual basis, the Cash Flow Statement
focuses only on real cash movement. This is why it is crucial to understand a company’s
liquidity
position.
A. Classification of Cash Flows
As per Schedule III, cash flows are classified into three activities:
i. Operating Activities
Cash flows from the core business operations of the company.
Examples:
- cash received from customers
- cash paid to suppliers and employees
These activities indicate whether the company’s main business is generating sufficient cash.
ii. Investing Activities
Cash flows that are related to the purchase or sale of long-term assets and
investments.
Examples:
- purchase of machinery
- sale of investments
These activities show how the company invests its funds.
iii. Financing Activities
Cash flows related to capital and borrowings.
Examples:
- issue of shares
- repayment of loans
- payment of dividends
These activities reflect changes in the company’s capital structure.
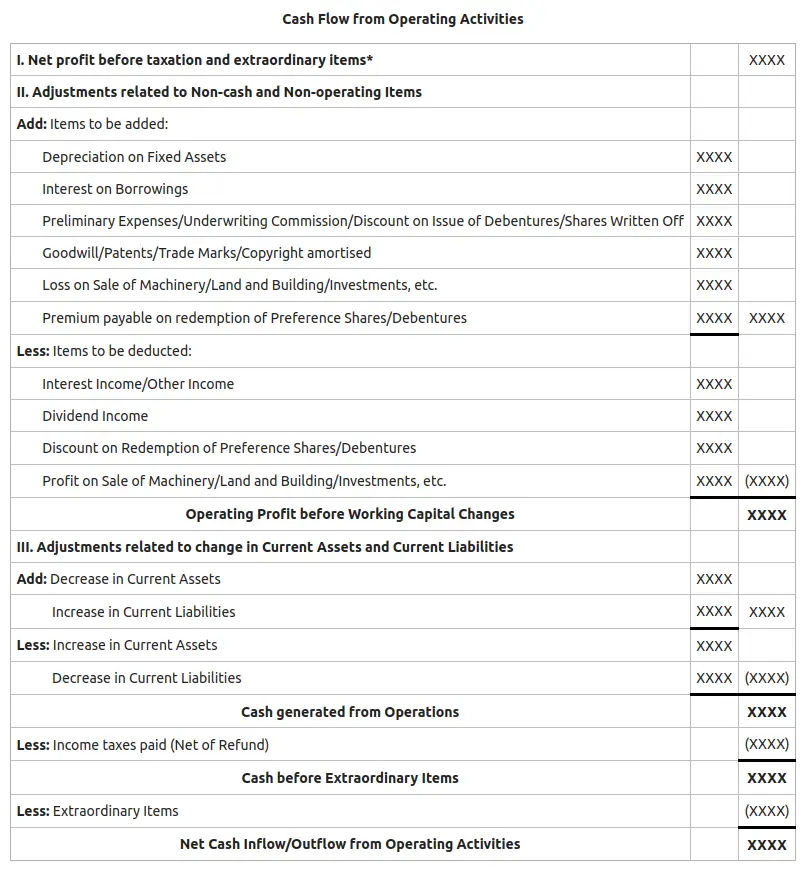
B. Methods of Preparing Cash Flow from Operating Activities
Operating activities can be calculated using two methods:
- Direct Method
- Indirect Method
Both methods arrive at the same cash flow, but the approach differs.
i. Direct Method
Under the Direct Method, actual cash receipts and cash payments are directly reported.
It
shows
gross cash inflows and outflows from operating activities.
Key Features of the Direct Method
- Cash received from customers
- Cash paid to suppliers
- Cash paid to employees
- Cash paid for operating expenses
This method is simple to understand but difficult to prepare because detailed cash
data is
required.
ii. Indirect Method
Under the Indirect Method, cash flow from operating activities starts with Profit
Before Tax
and
adjusts it for non-cash and non-operating items.
This method explains why profit is different from cash.
Adjustments Under the Indirect Method
The following adjustments are made:
- Add back non-cash expenses (depreciation, amortisation)
- Subtract non-operating incomes
- Adjust for changes in working capital
- increase in current assets → decrease in cash
- increase in current liabilities → increase in cash
This is the most common method used in practice.
FAQs
1. Why is the Schedule III format important for financial statements?
Schedule III ensures uniformity, clarity, and comparability in financial statements across
Indian companies. It helps users easily understand and analyse financial information.
2. What is the main difference between the Balance Sheet and the Statement of
Profit and Loss?
The Balance Sheet shows the financial position on a specific date, while the Statement of
Profit and Loss shows financial performance over a period of time.
3. Can a company be in profit but have a negative cash flow?
Yes. Profit includes non-cash items and credit transactions, whereas cash flow reflects
actual cash movement. This is why both statements are important.
4. Which cash flow method is commonly used by companies?
Most companies use the indirect method because it is easier to prepare and clearly explains
the difference between profit and cash.
5. Are financial statements useful only for accountants?
No. Financial statements are useful for students, business owners, investors, lenders, and
anyone who wants to understand how a company performs financially.
Also read- How to get
into Big4s?
Conclusion
SUnderstanding financial statements becomes much easier once the structure and logic are clear.
The Balance Sheet explains a company’s position, the Statement of Profit and Loss shows its performance,
and the Cash Flow Statement reveals actual cash movement.
When these statements are read together and in the Schedule III format, they give a complete and
reliable picture of a company’s financial health. For students and beginners, clarity of the new format
of financial statements is the first step toward confident learning and practical application in real
business scenarios.


.webp "M&A MasterClass")


 Tax")